Pilot: an agent that learned from reward investigated as well, at 40% of the cost
“Why did revenue fall 12% last week?” is one of the most common questions in any company, and one of the hardest to answer well. An analyst has to decide where to look first, read what comes back, form competing explanations, test them, drop the wrong ones, and stop when the evidence is sufficient. We built an environment to ask whether an agent can learn to investigate like that from outcomes, and ran a pilot.
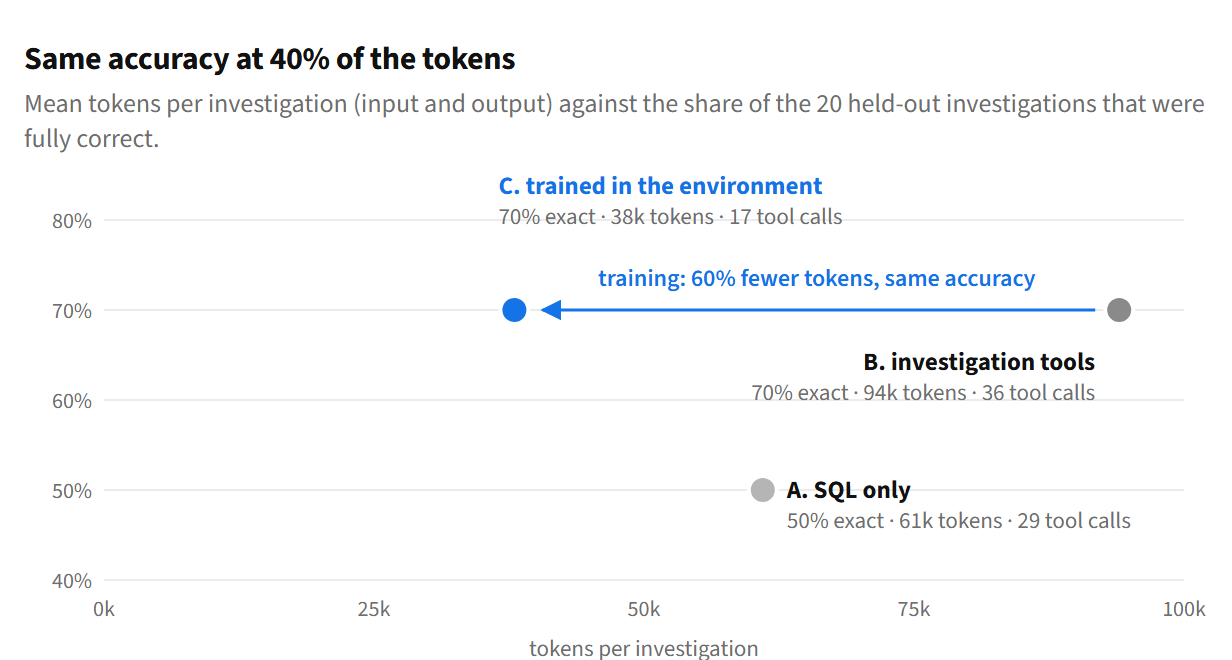
The headline, with the caveat first: this is a pilot with five held-out tasks per test type, so nothing below is statistically significant. Within it, an agent that learned from reward matched the accuracy of the best untrained agent (70% of investigations fully correct) while using 60% fewer tokens and half the tool calls, and it was the best agent on cause types it had never seen in training. It also learned one rule that generalised too far. The plan for the full test, and what would count as success, is at the end; its results will be published in a follow-up note.
Objective
Root-cause investigation is a sequential decision problem rather than a generation problem. There are many possible sequences of actions, every action returns new evidence, early choices shape what is worth doing next, there is no single correct path, and a good investigator has to recover from hypotheses that turn out wrong. Success, though, is measurable: did the investigation find what actually caused the decline?
A capable model with tools can already investigate. At each step it picks a reasonable next query. The question we care about is different: can an agent learn, from the outcomes of its own investigations, a better way to investigate? And is any improvement due to that learning, or just to giving it better tools?
For the pilot, “learning” means the approach from our earlier note: the model’s weights stay frozen, and it learns a playbook of lessons from environment reward. Training the weights themselves on the same environment is a later step. The pilot’s job was to check that the environment and its scoring are sound, and to see which way the results point.
Plan
A company to investigate
The Business Investigation Arena generates a company for every task: 19 tables and about 750,000 order lines across a data warehouse, operational orders, shipments, inventory, supplier receipts, CRM accounts and notes, support tickets, the web funnel, marketing spend, exchange rates, data-load logs and a company event feed.
Into each company we inject one or more real causes of a revenue drop — a stock-out, a warehouse outage, a price increase, a misconfigured promotion, a competitor launch, a marketing freeze, a lost reseller, key accounts leaving, payment failures, severe weather — together with decoys: evidence that looks relevant but moved no revenue, such as a campaign ending on schedule or an analytics tag under-counting web sessions. Because the simulator reuses its random draws, the true share of the decline caused by each cause is exact: re-run the same week without that cause and measure the difference.
The agent receives only the question, for example “Revenue for the APAC region in week 2026-W37 (2026-09-07 to 2026-09-13) was $8,568,041, 12.4% below the average of the previous four weeks ($9,781,946). Leadership wants to know why.”, and must submit each cause with its scope and its share of the decline.
Four kinds of test
- Familiar causes: the same kinds of cause the agent trained on, in new companies.
- Combined causes: two familiar causes at once, so their effects must be separated.
- Unseen cause types: causes never present in training — a currency move that changes dollar-reported revenue, a data-load failure that hides sales from reporting, and a supplier delay that cascades into stock-outs and lost accounts.
- Misleading decoy: a familiar cause plus a decoy chosen to point at the wrong explanation.
Three agents
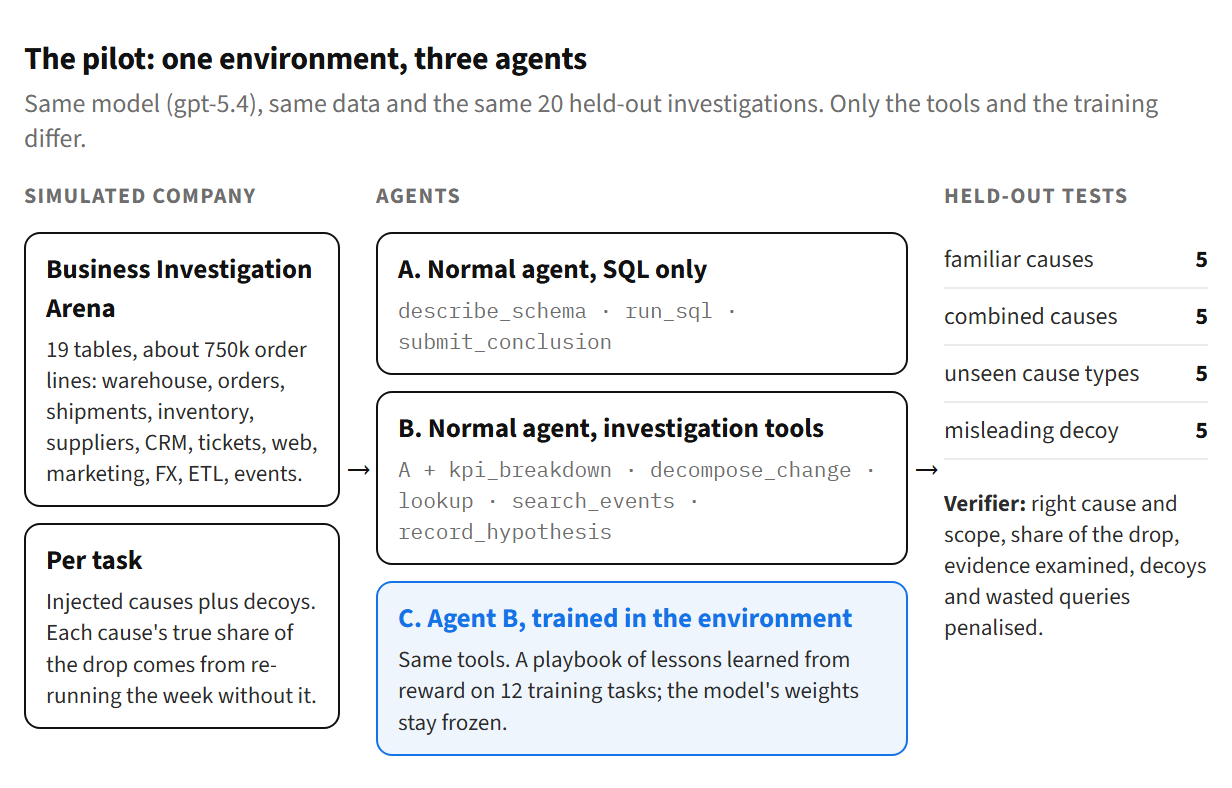
All three agents use the same model (gpt-5.4) and can reach exactly the same data. Agent A has the minimum a normal data agent gets: the schema, SQL, and a way to submit. Agent B adds a semantic analytics layer — breakdowns of the change by any dimension, a decomposition of a drop into volume, price, currency, fulfilment and reporting effects, entity lookups, event search and a hypothesis log. Agent C is agent B after training in the environment. Comparing B with A measures the tools; comparing C with B measures the learning.
Scoring
A verifier compares each submission with the simulator’s ground truth: whether each real cause is found with the right type and scope, how close its claimed share of the decline is, whether the agent actually examined the evidence for it, and penalties for naming decoys, inventing entities or wasting queries. An investigation is fully correct only if it finds every cause with the right scope, gets each share within 0.2 of the truth, and claims no decoy.
Experiments
| Model | gpt-5.4 via Azure OpenAI, default sampling |
| Held-out evaluation | 20 investigations: 5 per test type, identical for all three agents |
| Budget | up to 25 tool-using turns per investigation |
| Training (agent C) | 12 training companies with familiar causes only; 2 learning steps of 6 tasks × 2 attempts; the playbook is updated by reflecting on better and worse attempts and reading the true answer |
| Spend | about 5.9M tokens recorded across the three agents and a live smoke test |
Reading transcripts before trusting the numbers
Before comparing agents, we read their investigations against the ground truth. Three times, the scoring was wrong rather than the agents:
- Shares. Agents estimated a cause at about 71% of the observed decline; ground truth said 100%, because it divided by the total impact of the injected causes instead of the decline the question asks about. Shares are now a fraction of the observed decline.
- One cause, described twice. When an agent reported a single promotion error separately for online and partner orders, the second half counted as a false claim, and a 3% side note cost as much as a wrong 50% cause. Claims that identify the same cause are now combined, and false claims are weighted by the share they claim.
- Ambiguous labels. The SQL agent correctly described a data-load failure in its written summary but filed it under “tracking or measurement issue” rather than “data pipeline issue”, and scored zero. That near miss now earns partial credit, and every cause label has a definition for the full test.
The trained agent’s first run started under the second flaw, so we stopped it and trained again after the fix. All three agents are then scored by identical rules. It is the same discipline as our certificate work: the measuring instrument has to be checked before its verdicts mean anything.
Outcomes
| Agent | Fully correct | Mean reward | Tokens per investigation | Tool calls |
|---|---|---|---|---|
| A. Normal agent, SQL only | 50% | 0.769 | 61k | 29 |
| B. Normal agent, investigation tools | 70% | 0.822 | 94k | 36 |
| C. Agent B, trained in the environment | 70% | 0.820 | 38k | 17 |
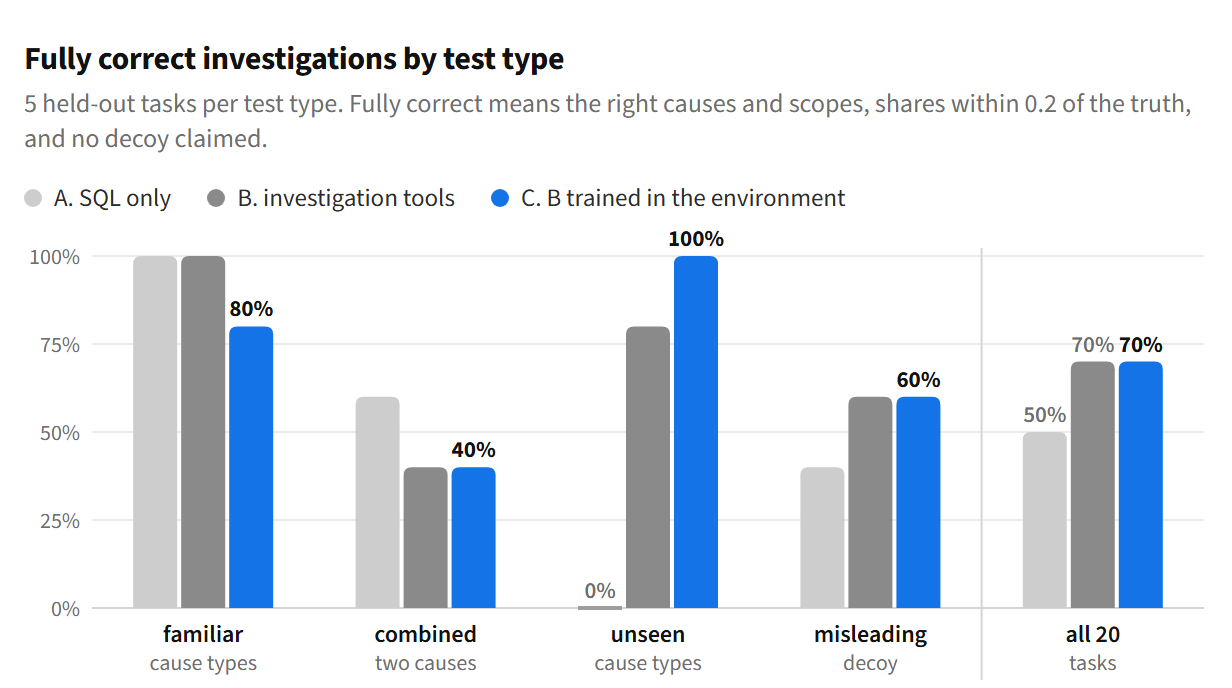
Better tools helped less than they first appeared. Agent B beat agent A by 0.05 in mean reward (95% interval −0.02 to +0.12). Before the labelling fix, B’s lead on unseen cause types looked like +0.59; afterwards it was +0.18. Much of the apparent advantage was A choosing a neighbouring label for a correct diagnosis.
Training matched accuracy at 40% of the cost. Agent C was fully correct as often as agent B while using 38,000 tokens and 17 tool calls per investigation instead of 94,000 and 36. Even during training, investigations became cheaper between the two learning steps (77,000 to 54,000 input tokens per attempt) while training reward rose from 0.80 to 0.84. On unseen cause types, agent C was fully correct on all five tasks.
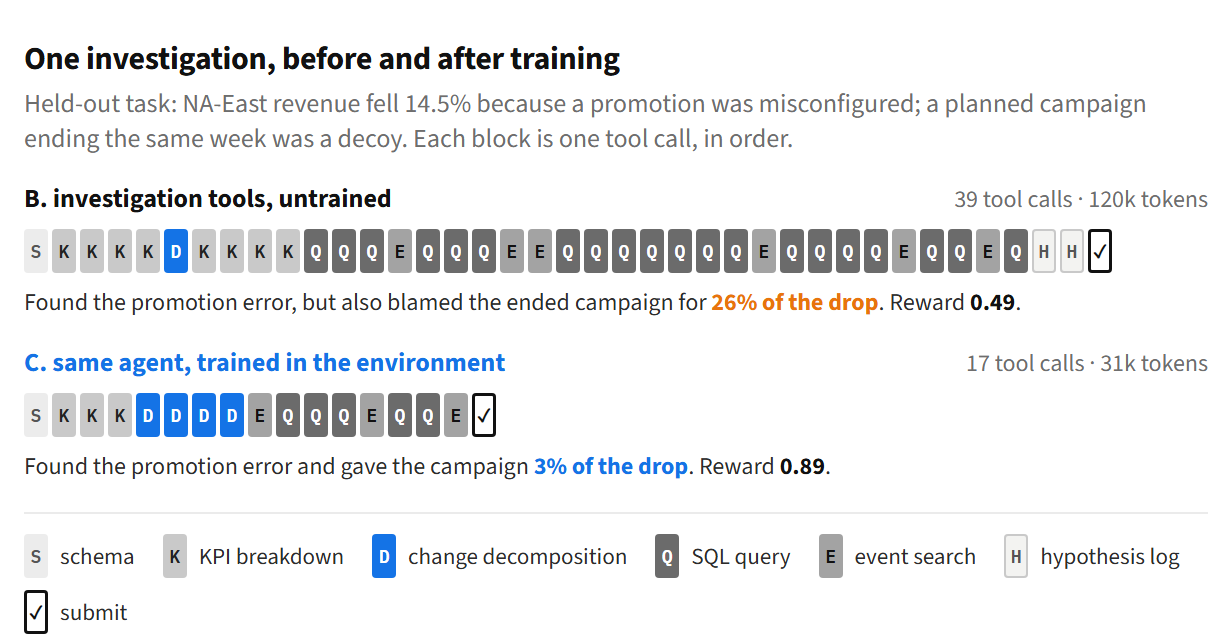
The difference is easiest to see on a single task. On a held-out investigation where a misconfigured promotion caused the drop and a campaign ending that week was the decoy, the untrained agent made 39 tool calls and blamed the campaign for a quarter of the decline. The trained agent made 17, decomposed the change early, and gave the campaign 3%.
It also learned a rule that went too far. The trained agent’s playbook is readable, which makes both its strengths and its mistakes inspectable. Most lessons describe a sensible investigation strategy: run broad cuts, decompose the change to classify its mechanism, confirm with one independent source, and stop. One lesson, written after a competitor launch in training, told it to prefer the external event over “the downstream symptom of fewer buyers”. On two held-out tasks where key accounts had genuinely left, it found the right accounts, read CRM notes saying they were moving to a competitor, and labelled the cause a competitor action. Both untrained agents got those tasks right. They account for the whole of its shortfall on familiar causes.
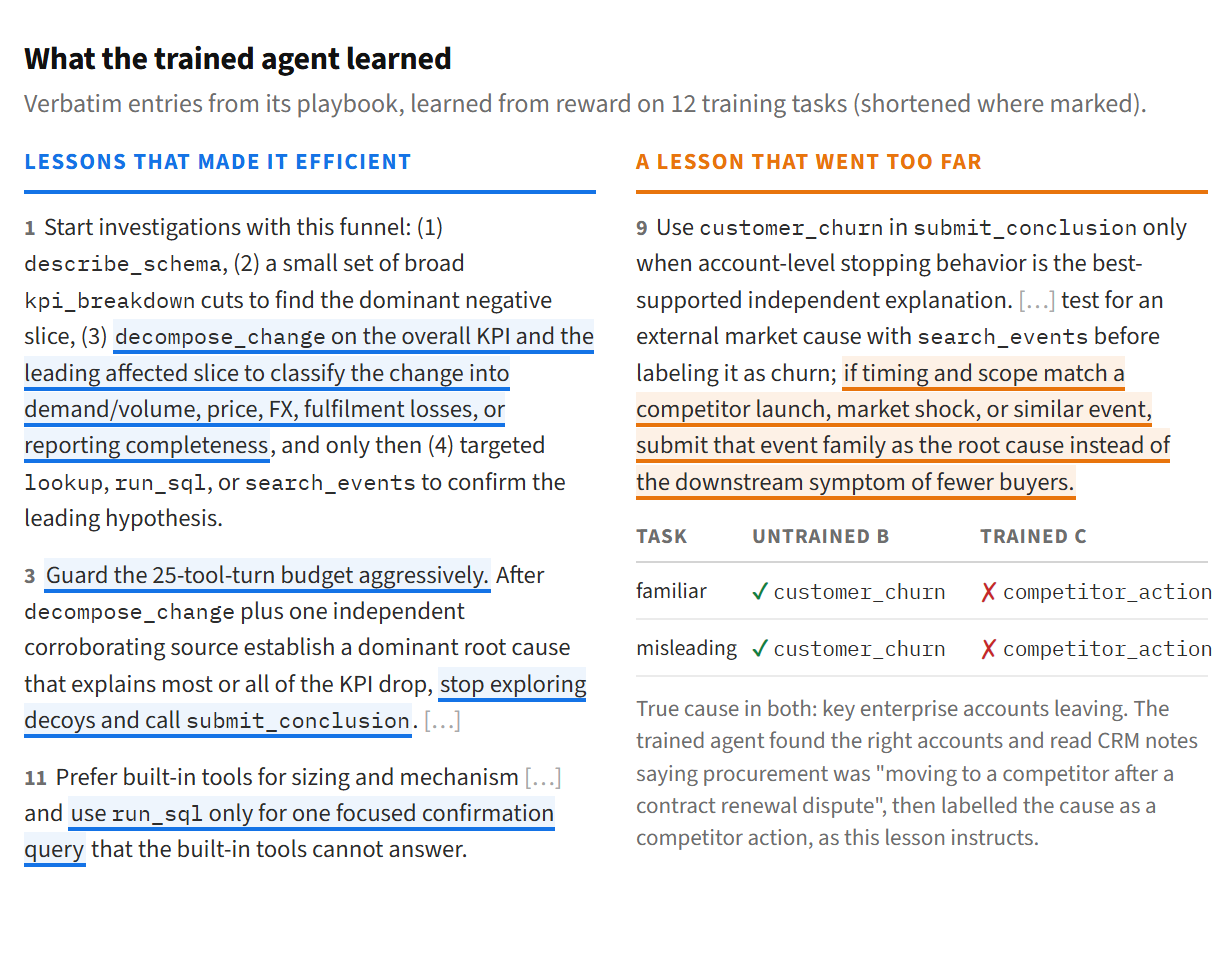
None of this is significant yet. With five tasks per test type, the smallest p-value a paired sign-flip test can produce is about 0.06, so no difference within a test type could reach significance, and overall the trained and untrained agents are level (difference in mean reward −0.002, 95% interval −0.16 to +0.12). The pilot shows direction, not proof.
Conclusion
What the pilot shows. The environment works end to end: companies with exact ground truth, investigations that run and submit, a verifier whose mistakes we could find and fix, and an agent that improves from its own outcomes. Learning from reward made the agent markedly more efficient without losing accuracy, and its best results came on causes it had never trained on, which is where learning an investigation strategy should matter most.
What it does not show. Five tasks per test type, one run, and only 24 training attempts cannot establish that learning beats a well-equipped untrained agent. Familiar causes are already solved by the untrained agents, so they cannot show a gain. The one over-general lesson is a warning: learning from a handful of tasks can also teach the wrong rule, and the pilot ran without the regression check designed to catch that.
Next: the full test
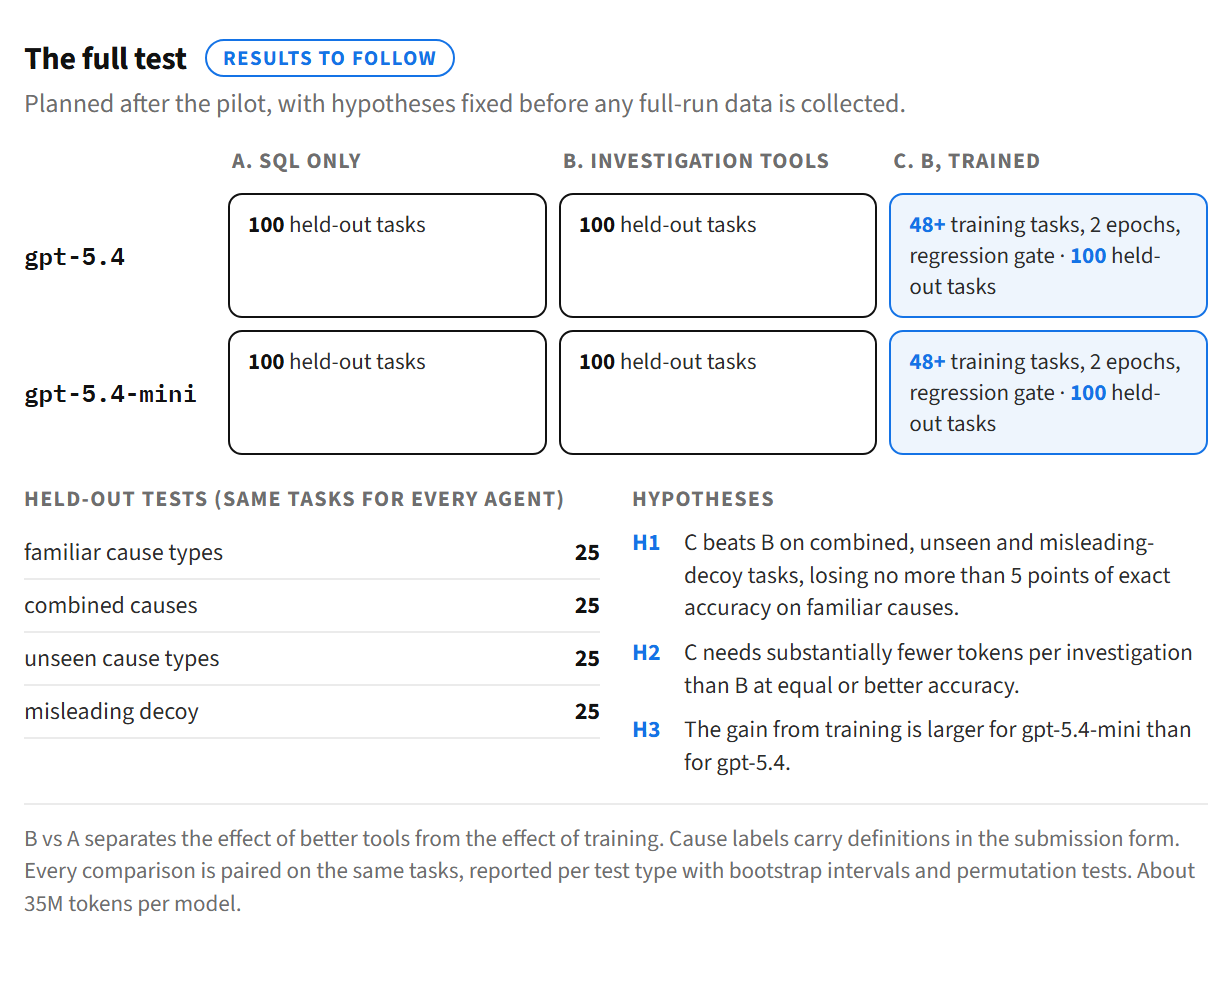
The full test keeps the pilot’s design and fixes what the pilot exposed:
- Two models. The three agents on gpt-5.4 and on the smaller gpt-5.4-mini, to see whether learning matters more for a weaker model.
- Enough tasks to decide. 100 held-out investigations per agent, 25 per test type, identical for every agent.
- More, and checked, training. At least 48 training companies over two epochs, with a regression gate that keeps a new playbook only if it does no worse on fresh training tasks.
- Clear labels. Every cause label carries a definition, so a wrong label is a real error rather than an ambiguity.
We fixed three hypotheses before running it:
- H1. The trained agent beats the untrained agent with the same tools on combined causes, unseen cause types and misleading decoys, while losing no more than five points of accuracy on familiar causes.
- H2. The trained agent needs substantially fewer tokens per investigation at equal or better accuracy.
- H3. The gain from learning is larger for gpt-5.4-mini than for gpt-5.4.
Every comparison will be paired on the same tasks and reported per test type with bootstrap intervals and permutation tests. We will publish the results in a follow-up note, including any hypothesis that fails.
If your team spends its time explaining why a metric moved, talk to us.